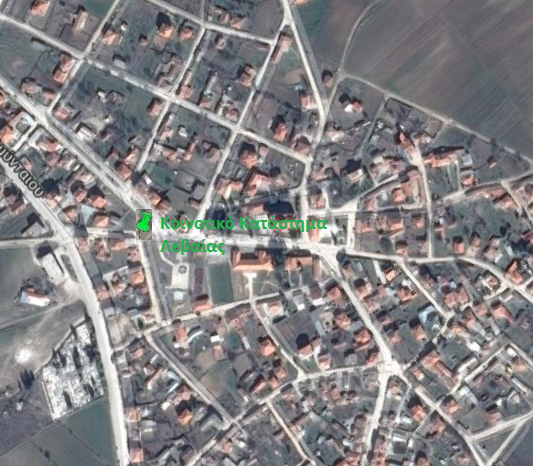
| Monitoring station: Levaia Community Office | |
| Monitoring station photos | Monitoring site location |
|
|
 |
| Site data | |
| Address | Levaia |
| Latitude, Longitude / Altitude | 21░ 42' 6.54"┼ , 40░ 38' 49.11"═ / |
| Activation date | 2015-03-26 |
| Temperature (last update) | 13´C |
| Last Update | 2019-04-20 13:30:00 |
| Electric field strength (six minute average values) | |||||
|
Frequency Band |
╠ean value (V/m) |
Maximum recorded value (V/m) |
|||
|
100kHz - 3GHz |
21.69 |
0.29 |
1.34 % (75) |
0.32 |
1.48 % (68) |
|
100kHz - 900MHz (Radio, TV) |
21.69 |
< 0.2 |
< 0.92 % (> 108) |
< 0.2 |
< 0.92 % (> 108) |
|
900MHz - 3GHz |
31.76 |
< 0.2 |
< 0.63 % (> 159) |
< 0.2 |
< 0.63 % (> 159) |
|
|
|||||
| Last week's chart for the electric field strength | |||||
|
| |||||